


※ HemI INTRODUCTION:
A heatmap is a graphical representation of data where the individual values contained in a matrix are represented as colors. To estimate how many papers contains heatmap, we went through all original research articles published in 2012 of five leading journals of this field, namely Genome Biology (GB), Genome Research (GR), Molecular & Cellular Proteomics (MCP), Nature Biotechnology (NBT) and Cancer Cell, respectively and found that over 30.4% (202 out of 664) contain at least one figure for heatmap.
In this work, we present a novel software of HemI (Heatmap Illustrator, version 1.0) for experimentalists, to prepare publication-quality figures of heatmap.The HemI is written in JAVA 1.6 (J2SE 6.0) and packaged with Install4j 4.0.8. Thus, the HemI 1.0 can be easily installed on a computer. Then we developed several packages to support three major operating systems (OS), including Windows, Unix/Linux, and Mac. The Windows XP/7, Ubuntu, Apple Mac OS X 10.5 (Leopard) were chosen to test the stability of HemI 1.0 for Windows and Linux systems, a Java Runtime Environment 6 (JRE6) package of Oracle should be installed first or you can choose install package which include JRE.
Note: the HemI 2.0 has been launched. New Features
HemI 2.0: http://hemi.biocuckoo.cn/
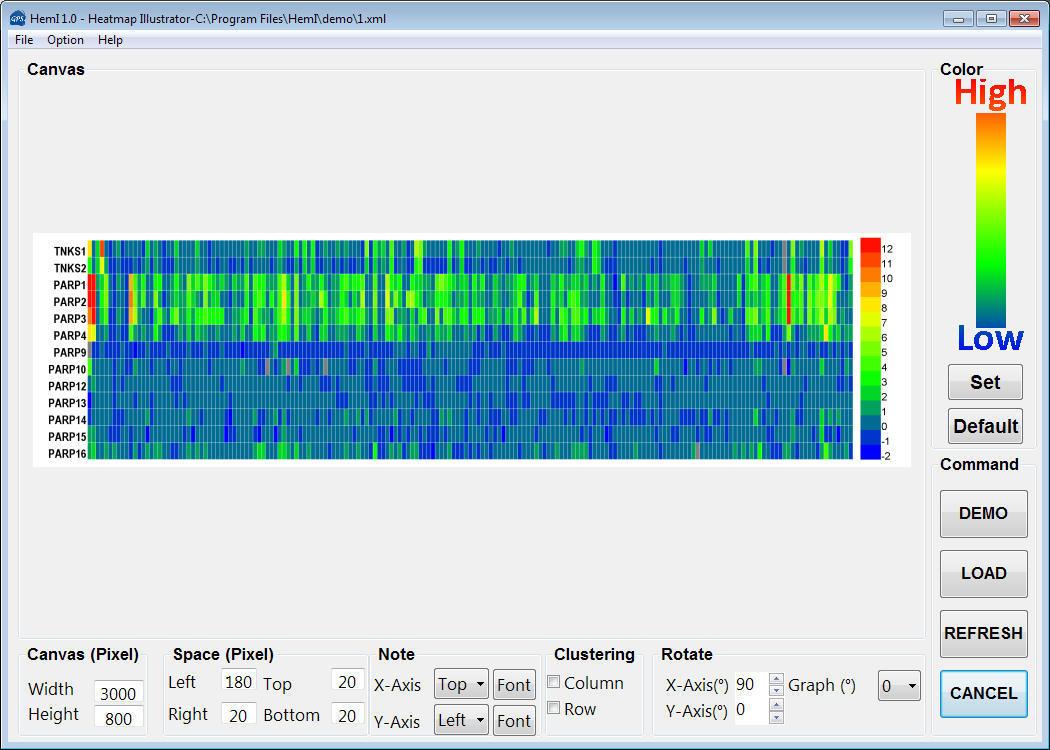
HemI 1.0 User Interface
For publication of results please cite the following article:  HemI: A Toolkit for Illustrating Heatmaps
Wankun Deng, Yongbo Wang, Zexian Liu, Han Cheng and Yu Xue. PLoS One 2014 Nov 5;9(11):e111988. [Abstract] | [Full Text] | [PDF] |